Glucagon–like peptide-1 receptor agonists (GLP-1RAs) and GLP-1RA-based therapies are currently considered to be one of the most attractive classes of medications for managing type 2 diabetes (T2D) because of their impressive weight loss properties, glycated haemoglobin (HbA1c) reduction, beneficial impact on blood pressure, lipids, metabolic dysfunction-associated steatotic liver disease, renal outcomes, cardiovascular protection and reduction in heart failure.1–3 These cardiorenal and metabolically beneficial properties of GLP-1RAs make them ideal for managing the global pandemic of diabesity.4
Among all the GLP-1RAs available for clinical use, only semaglutide is available as an oral preparation. Oral semaglutide was approved for clinical use by the US Food and Drug Administration (FDA) and the European Medicines Agency (EMA) in September 2019 and April 2020, respectively. 5 6,7 Oral semaglutide helps to overcome the injection barrier of subcutaneous GLP-1RAs across many ethnic groups worldwide, and thus enhances convenience and patient acceptance.8 Oral semaglutide has a unique administration profile, requiring it to be taken on an empty stomach and to wait a 30 minute post-dose interval before eating or taking other medications to ensure adequate and maximal drug absorption and bioavailability for clinical efficacy; issues that are not seen with once-weekly injectable semaglutide.8 Hence, oral and injectable semaglutide are practically different medicines, and the clinical efficacy/safety data of one preparation cannot be extrapolated to the other. Since there are no meta-analysis on real world use of oral semaglutide, we aimed to quantitatively analyse the efficacy and safety of oral semaglutide use in RWSs.
Methods
Ethical compliance
This article adhered to the standardized methodology described in the Cochrane Handbook for Systematic Reviews and was reported following the Preferred Reporting Items for Systematic Reviews and Meta-Analyses (PRISMA) guidelines.9 The study was registered with PROSPERO (International Prospective Register of Systematic Reviews; registration number: CRD420251154717), with open online access to the protocol summary.10
Search strategy
A comprehensive database search was conducted in PubMed, Ovid Embase, Ovid Medline, Cochrane Library, ClinicalTrials.gov, China National Knowledge Infrastructure (CKNI), ctri.nic.in and Google Scholar up to September 2025. We used key terms such as ‘oral semaglutide’ and ‘diabetes’ OR ‘obesity’ combined with Boolean operators to refine retrieval. References in the published articles were also screened manually to identify eligible studies.
Eligibility criteria
The PICOS (Population, Intervention, Comparator, Outcomes, and Study design) criteria were utilized to screen and select the studies. The population (P) included people living with T2D and/or with obesity. The intervention (I) consisted of the use of oral semaglutide along with the standard of care for managing T2D/obesity. Oral semaglutide was administered once daily at doses of 3, 7 and 14 mg. Recently investigated higher dose oral semaglutide for obesity management, as well as newer oral formulations with alternative dose strengths (e.g. 1.5, 4 and 9 mg once daily), were not included in this meta-analysis due to the lack of corresponding real-world evidence at the time of analysis.11,12 The control (C) group (if available) used placebo or any other approved medication for T2D/obesity.13–16 In addition, studies without a control group were considered for single-arm and proportion meta-analysis. The outcomes (O) focused on HbA1c reduction, weight reduction, per cent weight reduction, ability to achieve HbA1c <7%, hypoglycaemia and adverse effects. The study type (S) comprised RWSs (both single–armed and double–armed studies). Cross-sectional studies, case reports, reviews, expert opinions, editorials, letters to the editor and duplicate reports were excluded from the analysis. Duplicates were removed before screening articles by title and abstract, followed by full-text screening to confirm eligibility.
Study outcomes
Primary outcome
The primary outcome was the mean change in percentage HbA1c from baseline to 6 and 12 months follow–up after starting oral semaglutide.
Secondary outcomes
Secondary outcomes were pre-specified to evaluate the metabolic and safety effects of oral semaglutide. These included:
-
Glycaemic efficacy: proportion of participants achieving HbA1c <7%.
-
Weight outcomes: mean change in body weight (kg) and body mass index (BMI; kg/m2); and proportion of patients achieving ≥3% and ≥5% weight reduction, respectively.
-
Cardiometabolic outcomes: mean change in systolic blood pressure (SBP; mmHg) and diastolic blood pressure (DBP;, mmHg) and total cholesterol (mg/dL).
-
Safety and tolerability outcomes: pooled prevalence of total adverse events (TAEs), serious adverse events (SAEs), discontinuation or dose reduction due to adverse events (AEs), gastrointestinal AEs (nausea, diarrhoea) and hypoglycaemia (any/severe).
Study selection
Two reviewers independently evaluated all identified articles by first screening titles and abstracts, followed by full-text review. Studies were included if they met the pre-defined criteria, and any uncertainty was resolved through discussion with a third author.
Data extraction
Data extraction was carried out independently by two authors using a structured extraction sheet for this article. When multiple publications originated from the same study population, data were merged and analysed as a single set. The variables included first author, publication year, the country of origin, study design, methodology, anthropometric data, diabetes duration, HbA1c, medication profile and the pre-specified outcomes. Inconsistencies were settled by consensus.
Data synthesis and statistical analysis
Statistical analysis was performed using RStudio (version 2025.4.5.0; Posit Software, Public Benefit Corporation, Boston, MA, USA) with the meta and metafor packages in R (R Foundation for Statistical Computing, Vienna, Austria).17 Continuous outcomes were summarized using mean values and standard deviations, while categorical outcomes were expressed as frequencies or proportions. Effect sizes for continuous parameters were reported as mean differences, and categorical outcomes were analysed using odds ratios or risk ratios, each presented with 95% confidence intervals (CIs). In the studies with an active control group, changes from baseline values of the continuous and categorical outcomes in the semaglutide versus control groups for the categorical variables were calculated. For the single-arm cohorts, we calculated the mean change from baseline for all available outcomes and pooled these estimates across included studies. Because the included studies varied in design, population characteristics and follow-up duration, a random-effects model was selected as the primary analytical framework. The analysis applied a restricted maximum-likelihood approach to estimate τ², while CIs for τ and τ² were derived using the Q-profile method. Heterogeneity (I²) was calculated from the Q statistic using raw, untransformed means. Pre-specified subgroup analysis was performed to explore regional differences in treatment response and safety. Each study was categorized by its geographical origin as either Asian or RoW (non-Asian) based on its country of origin. Subgroup meta-analyses were conducted wherever adequate data were available. All analyses were performed in R using the meta package. For consistency across the forest plots, author names appear as they were exported from the original datasets (e.g. Jimenez B = Rodríguez Jiménez B; Roychoudhury S = Roy Chowdhury S; Roychowdhury S = RoyChaudhuri S; Vidas M = Marques Vidas M; Houtum = van Houtum). Full and correct author names are used in the manuscript text and reference list.
Assessment of heterogeneity and publication bias
Heterogeneity was quantified using I² statistics, with values below 30% reflecting low variability, 30–75% suggesting moderate variation and >75% indicating substantial heterogeneity.18 Publication bias was assessed visually using funnel plots and statistically using Egger’s regression; where applicable, assessment of heterogeneity was initially performed by examining forest plots.
Assessment of the quality of the included studies
Study quality was examined using the Risk Of Bias In Non-randomized Studies of Interventions, Version 2 (ROBINS-I V2) for both RCTs and non-randomized intervention trials.19 The ROBINS-I V2 tool evaluates seven domains, including confounding, participant selection, intervention classification, deviations, missing outcome data, measurement bias and reporting accuracy. Each study received an overall rating of low, moderate or high risk based on domain-level judgement. In case of discrepancies, the third and fourth authors reached a consensus. Risk-of-bias plots were created using the Risk-of-bias VISualization (robvis) web application (version 0.3.0; University of Bristol, Bristol, UK).20,21
Results
An initial search revealed 622 articles. Forty-two duplicates were removed. Following screening of the titles and the abstracts, the search identified 72 eligible articles, which were evaluated in detail for consideration for inclusion in this systematic review and meta-analysis (SRM). Finally, data from 59 articles, which fulfilled all inclusion and exclusion criteria, were analysed in this SRM.22–78 The flow of patients has been elaborated in the PRISMA flow chart (Figure 1).
Figure 1: Flowchart elaborating on study retrieval and inclusion in this systematic review and meta-analysis
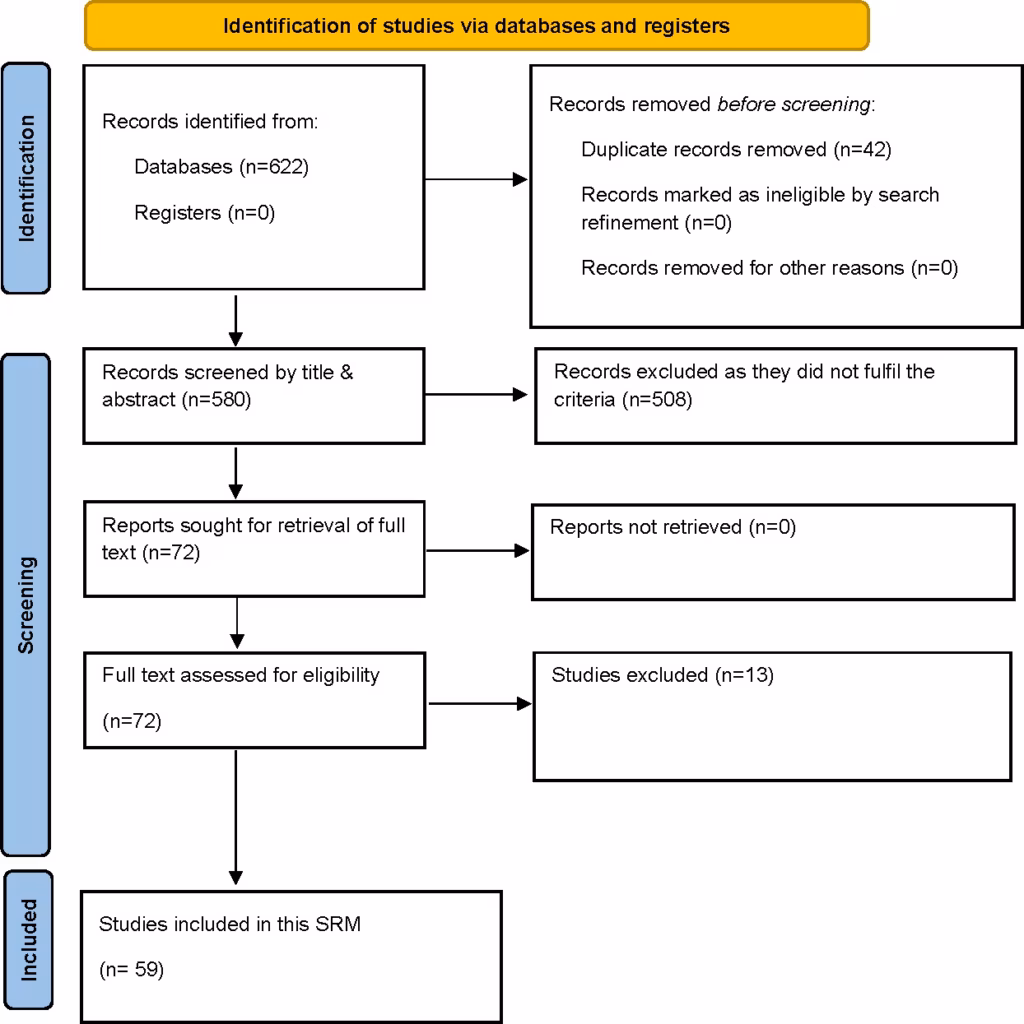
SRM = systematic review and meta-analysis
Study characteristics
The characteristics of the different studies analysed in this SRM have been elaborated in Table 1.22–80 Table 2 shows the different medications received by the patients in different studies.22–27,29–32,34–37,40–43,45–50,52,56–59,62,64,65,67–69,71,74,75,77,78 The maximum number of analysed articles was from Italy (n=16), followed by Japan (n=9), India (n=8), the USA (n=6), Spain (n=5), two articles each from the UK, Switzerland and the Middle East (United Arab Emirates, Saudi Arabia and Kuwait) and one article each from Canada, Croatia, China, Denmark, Sweden, the Netherlands, Poland, Romania and Slovenia (Table 1). Subgroup analysis of data from the articles was performed comparing the outcomes in Asians (n=20) with Europeans (n=32) and North Americans (n=7).
Table 1: Baseline characteristics of studies included for the meta-analysis22–80
| Study details | Major inclusion criteria | Primary outcomes | N | Female (%) | Age (years), mean ± SD or median (IQR) | Weight (kg), mean ± SD or median (IQR) | BMI (kg/m2), mean ± SD or median (IQR) | HbA1c (%), mean ± SD or median (IQR) | Duration of diabetes (years), mean ± SD or median (IQR) | Study duration |
| Alsheikh et al., 2024;23 retrospective observational; Saudi Arabia | Adults with T2D | Change in HbA1c | 245 | 49.8 | 54.6 ± 8.4 | 113.1 ± 20.6 | 38.2 ± 6.9 | 10.1 ± 1.2 | 12.2 ± 4.6 | 12 months |
| Delgado Álvarez et al., 2025;24 phase IV multicentric prospective observational; Spain | Adults with T2D | Change in HbA1c | 458 | 40 | 59.4 ± 11.4 | 100.6 ± 20 | 36.4 ± 6.4 | 7.8 ± 1.6 | 6.6 ± 7.2 | 34–44 weeks |
| Aoyama et al., 2024;25 retrospective observational; Japan | Adults with T2D | Changes in cardiometabolic parameters | 153 | 30 | 61 ± 7.1 | 77.9 ± 6.5 | 28.2 ± 5 | 7.9 ± 4.07 | NR | 6 months |
| Aroda et al., 2021;26 retrospective observational; USA | Adults with T2D | Change in HbA1c | 782 | 54.5 | 57.8 ± 11.3 | 104.9 ± 24 | 36.2 ± 7.6 | 8.4 ± 1.8 | 6.9 ± 4.8 | 6 months |
| Baldassarre et al., 2024;27 retrospective observational; Italy | Adults with T2D | Change in HbA1c and body weight | 192 | 44 | 67 (15) | 82.47 ± 17.63 | 30.41 ± 5.86 | 7.9 ± 1.19 | 9 (12) | 6 months |
| Baronti et al., 2024;28 retrospective observational; Italy | Adults with T2D |
| 1,824 | 40.8 | 65.4 ± 10.9 | 88.6 ± 19.2 | 31.2 ± 5.9 | 8 ± 1.6 | 11.1 ± 8.2 | 12 months |
| Bawa et al., 2025;29 retrospective observational; India | Adults with T2D | Change in HbA1c | 51 | 35.3 | 51.22 ± 11.78 | 97.4 ± 17.5 | NR | 8.16 ± 1.37 | 10.79 ± 6.83 | 12 months |
| Bonora et al., 2024;30 retrospective observational; Italy | Adults with T2D | Change in HbA1c | 166 | 35.5 | 64.4 ± 8.6 | 81.7 ± 16.9 | 28.9 ± 5.3 | 7.5 ± 1.3 | 10.1 ± 8.2 | 18 months |
| Candido et al., 2023;31 retrospective observational; Italy | Adults with T2D | Change in HbA1c | 129 | 43 | 72 (66–79) | NR | 28.8 (26.3–32.8) | 7.2 (6.6–8) | 11 (6–22) | 6 months |
| Catrina et al., 2024;32 phase IV multicentric prospective observational; Sweden | Adults with T2D | Change in HbA1c | 187 | 35.3 | 62.5 ± 10.98 | 97.3 ± 19.5 | 32.4 ± 5.8 | 7.7 ± 1.2 | 6.8 ± 5.7 | 34–44 weeks |
| Chittawar et al., 2025;33 retrospective observational; India | Adults with T2D | Change in HbA1c | 340 | 40.3 | 48.11 ± 11.44 | 94.49 ± 19.09 | 33.56 ± 6.08 | 8.59 ± 1.27 | – | 30 weeks |
| Conti et al., 2025;80 retrospective observational; Italy | Adults with T2D | Medication persistence | 121 | 42 | 67 ± 11 | NR | 30.5 ± 5.6 | 7.7 ± 1.1 | 10.8 ± 8.7 | 18 months |
| Costa et al., 2025;34 retrospective observational; Italy | Adults with T2D | Change in HbA1c | 104 | 41.4 | 68.9 ± 9.9 | 83.2 ± 15.7 | 30.5 ± 5.2 | 7.62 ± 0.96 | 15.7 ± 8.7 | 37 weeks |
| Del Prete et al., 2025;35 retrospective observational; Italy | Adults with obesity or overweight and T2D | Change in weight, BMI, HbA1c | 46 | 52.1 | 65.7 ± 12.8 | 95.2 ± 15 | 34.3 ± 5.3 | 7.6 ± 1.6 | NR | 24 months |
| Dutta et al., 2024;36 retrospective observational; India | Adults with T2D and prediabetes | Effectiveness (glycaemic metrics, weight, body composition), safety and tolerability | 351 | 49 | 53 (43–61) | 91 (79.2–103) | 32.74 (29.34–36.64) | 7.9 (6.9–9) | 10 (5–16) | Four follow–up visits (up to 351 days) |
| Fadini et al., 2025;37 retrospective observational; Italy | Adults with T2D | Change in HbA1c | 105 | 35.2 | 64.6 ± 8.7 | 82.9 ±17.9 | 29.1 ± 5.5 | 7.6 ± 1.1 | 10.1 ± 7.9 | 18 months |
| Fiore et al., 2024;79 retrospective observational; Italy | Adults with T2D, age ≥65 years | Change in HbA1c | 101 | 63.4 | 74.7 ± 6.1 | 76.8 ± 14.1 | 28.7 ± 4.7 | 7.4 ± 0.88 | 8 ± 5.1 | 6 months |
| Formichi et al., 2024;38 retrospective observational; Italy | T2D, oral versus subcutaneous semaglutide | Not mentioned | 115 | 42 | 65.2 ± 10.4 | 80 ± 15.2 | 29.1 ± 4.7 | 7.7 ± 1.3 | 12.8 ± 10.2 | 6 months |
| Frazer et al., 2023;39 retrospective observational; USA | Adults with T2D | Change in HbA1c | 1,012 | 50 | 59 ± 11.8 | NR | NR | 8.2 ± 1.7 | NR | 6 months |
| Furusawa et al., 2024;40 retrospective observational; Japan | T2D, age ≥20 years | Changes in HbA1c, safety assessed by any AEs leading to drug discontinuation | 434 | 44 | 55.5 ± 12.6 | 80.2 ± 19.2 | 29.6 ± 6 | 7.65 ± 1.11 | NR | 12 months |
| Gašparini et al., 2024;41 retrospective observational; Croatia | Adults with T2D | Change in cardiovascular risk factors | 53 | 50.94 | 65 ± 9 | NR | 31.4 (29.7–34.9) | 7.6 (7.0–8.2) | 5 (2–11) | 9 months |
| Gudibanda et al., 2024;42 retrospective observational; India | Adults with T2D | Change in HbA1c, BMI and body weight | 188 | 48.4 | 51.31 ± 11.07 | 91.1 ± 10.46 | 35.22 ± 3.53 | 8.11 ± 0.84 | NR | 160 days |
| Hassanein et al., 2025;43 multicentric prospective observational; UAE, Saudi Arabia, Kuwait | Adults with T2D | Change in HbA1c | 257 | 42 | 52.94 ± 9.7 | 89.8 ± 18.7 | 32.3 ± 5.8 | 6.8 ± 1.2 | NR | 20 weeks |
| Hirotsu et al., 2025;44 prospective pilot study; Japan | Adults with T2D, HbA1c 7–10.5%, switched from DPP-4i | Baseline characteristics, and differences in haematological tests between those who achieved HbA1c <7% and those who did not | 61 | 34 | 61.7 ± 3.6 | NR | 27.3 ± 1.01 | 8.02 ± 0.23 | 16.25 ± 2.8 | NR |
| Horii et al., 2024;45 retrospective observational; Japan | Adults with T2D | Frequency of discontinuation of semaglutide over 12 months | 6,140 | 41.3 | 60.5 ± 14.2 | NR | 29.6 ± 6.3 | NR | NR | 12 months |
| van Houtum et al., 2024;46 phase IV multicentric prospective observational; Netherlands | Adults with T2D | Change in HbA1c | 187 | 46 | 58.8 ± 11.36 | 103.1 ± 19.51 | 35.1 ± 5.9 | 8.6 ± 1.28 | 8.7 ± 5.92 | 34–44 weeks |
| Ishiguro and Ishiguro, 2025;47 retrospective observational; Japan | T2D, HbA1c >7% | Changes in mean HbA1c at 180 days, HbA1c reduction to <7%, weight reduction ≥3% | 169 | 29.6 | 63.0 (54.0–70.0) | 75.0 (66.0–87.4) | 27.2 (24.4–30.9) | 7.7 (7.2–8.3) | 10.0 (5.0–17.0) | 180 days |
| Jain et al., 2023;48 multicentric prospective observational; Canada | Adults with T2D | Change in HbA1c | 182 | 35.7 | 58.6 ± 10.9 | 93.7 ± 22.7 | 32.5 ± 6.7 | 8 ± 1.36 | 8.1 ± 6.9 | 34–44 weeks |
| Janić et al., 2023;49 prospective open-label interventional; Slovenia | Adults with T2D, age 30–65 years, HbA1c >7%, BMI >30 kg/m2 | Change in glycaemic parameters and body weight | 20 | 45 | 59.9 ± 1.5 | 100.9 ± 2.7 | 34.6 ± 1.4 | 9.4 ± 0.3 | 8.5 ± 1.4 | 3–5 months |
| Rodríguez Jiménez et al., 2024;50 retrospective observational; Spain | Adults with T2D and obesity (BMI ≥30 kg/m2) | Change in body fat mass | 33 | 33.33 | 61.8 ± 7 | 94.8 ± 15.6 | 33.2 ± 3.9 | 9.3 ± 1.9 | 9.6 ± 6.3 | 24 weeks |
| Kesavadev et al., 2025;51 retrospective observational; India | Adults with T2D | Change in HbA1c and BMI | 52 | 32.7 | 50.79 ± 14.95 | 81.79 ± 17.56 | 30.05 (25.59–32.89) | 8 (7.1–9.5) | NR | 6 months |
| Kick et al., 2024;52 multicentric prospective observational; Switzerland | Adults with T2D | Change in HbA1c | 185 | 36.2 | 62 ± 10.4 | 95.6 ± 17.9 | 33.2 ± 4.8 | 7.7 ± 1.5 | 6.4 ± 5.3 | 34–44 weeks |
| Krajnc et al., 2025;53 retrospective observational; Poland | Adults with obesity, without diabetes | NR | 93 | 57 | 51.3 ± 12.5 | 105 ± 18 | 35 ± 6 | NR | NR | 1 year |
| Kwon et al., 2025;54 retrospective observational; USA | Adults with T2D | Change in weight | 57 | 31.6 | 60.7 ± 10.5 | 90.67 | NR | NR | NR | 2 years |
| Lunati et al., 2024;55 retrospective observational; Italy | Adults with T2D | Change in HbA1c | 544 | NR | NR | 80.4 ± 13.5 | 28.6 ± 3.3 | 7.6 ± 0.7 | NR | 6 months |
| Lv et al., 2024;56 retrospective; USA | Adults with T2D | Adherence and persistence to index medication over 12 months | 5,485 | 48.1 | 52.7 ± 9.3 | NR | NR | NR | NR | 12 months |
| Manti et al., 2025;57 phase IV multicentric prospective observational; Italy | Adults with T2D | Change in HbA1c | 445 | 40 | 62.9 ± 10.2 | NR | 31.2 ± 6 | 7.8 ± 1.3 | 8 ± 6.9 | 34–44 weeks |
| Moreno-Pérez et al., 2024;58 retrospective observational; Spain | Adults with T2D | Weight reduction ≥5%, HbA1c reduction ≥1% | 1,018 | 46.1 | 63 (56–70) | 94 (83.7–108) | 33.8 (31.1–38.7) | 7.8 (6.9–8.8) | 7.5 (6.9–8.8) | 12 months |
| Oe et al., 2024;59 retrospective observational; Japan | T2D, age ≥65 years, HbA1c ≥7% | Change in HbA1c | 30 | 50 | 76.2 ± 7.3 | 56.4 ± 10.8 | 23.4 ± 3.1 | 8 ± 2.9 | 17.0 (9.5–24.0) | 6 months |
| Palazzi et al., 2025;60 observational; Italy | T2D | Reduction in HbA1c and body weight | 167 | 46 | 69 (12) | 83.3 (19) | 29.6 (7.1) | 8.4 ± 1.5 | 7.6 ± 4.2 | 3 months |
| Pantanetti et al., 2024;61 prospective observational; Italy | Adults with T2D | Change in HbA1c, FPG, body composition, body weight, BMI | 61 | 21.4 | 61 ± 9.9 | 89.19 ± 5.84 | 30.81 ± 1.96 | 7.92 ± 1.33 | 4.67 ± 3.93 | 6 months |
| Pinto et al., 2024;62 retrospective observational; USA | Adults with T2D | Change in HbA1c and weight | 23 | 47.8 | 59 (55–64) | 110 (82.8–124.4) | 35.7 (28.5–41.5) | 8.2 (7–10.2) | NR | 6 months |
| Popoviciu et al., 2025;63 prospective observational; Romania | Adults with T2D (HbA1c >7.2%) and obesity (BMI ≥25 kg/m2) | Change in HbA1c | 114 | 40.4 | 59.37 ± 9.28 | 95.56 ± 11.75 | 34.95 ± 5.35 | 8.83 ± 1.44 | 6.51 ± 2.74 | 6 months |
| Ray et al., 2024;64 retrospective observational; India | Adults with T2D | Change in HbA1c | 80 | 30 | 46.6 ± 8.1 | 82.27 ± 22.2 | NR | 8.67 ±1.3 | 5.8 ± 3.9 | 18 months |
| Roy Chowdhury et al., 2024;65 retrospective observational; UK | Adults with T2D | Change in HbA1c | 53 | 51 | 58.45 ± 10.35 | 109.74 ± 27.74 | 39.28 ± 10.17 | 9.28 ± 1.29 | NR | 6 months |
| RoyChaudhuri et al., 2023;66 retrospective observational; India | Adults with T2D | Change in glycaemic metrics on AGP | 10 | 60 | 58.3 ± 11.26 | NR | 30.3 ± 4.03 | NR | NR | 4 weeks |
| Sansone et al., 2025;22 retrospective observational; Italy | Adults with T2D | Change in HbA1c | 950 | 63.7 | 68.3 ± 10.1 | 82.5 ± 17.6 | NR | 8 ± 1.3 | 13.9 ± 9 | 12 months |
| Sanyal et al., 2025;67 multicentric prospective observational; India | Adults with T2D | Change in HbA1c | 388 | 44.8 | 50.1 ± 10.6 | 89 ± 16.7 | 33.1 ± 5.6 | 9 ± 1.49 | 6.3 ± 5.8 | 34–44 weeks |
| Saravanan et al., 2024;68 multicentric prospective observational; Switzerland | Adults with T2D | Change in HbA1c | 333 | 38.7 | 58.5 ± 11.94 | 102.8 ± 24.13 | 35.5 ± 7.96 | 8.6 ± 1.44 | 7.2 ± 5.9 | 34–44 weeks |
| Sato et al., 2024;69 retrospective observational; Japan | Adults with T2D on 14 mg oral semaglutide | Change in HbA1c | 66 | 25.8 | 56.1 ± 12.1 | 90 ± 20.5 | 32 ± 7.2 | 7.4 ± 1 | 11.3 ± 7.2 | 24 weeks |
| Swift et al., 2023;70 retrospective observational; USA | Adults with T2D | Change in HbA1c | 520 | 41 | 57.8 ± 11.3 | NR | NR | 8.8 ± 1.5 | NR | 6 months |
| Trenas et al., 2025;71 prospective; Spain | HFpEF, T2D, obesity | HF health status, change in body weight at 18 months | 202 | 58.4 | 77.5 ± 12 | 95.4 ± 16.4 | 34.1 ± 3.1 | 7.8 ± 1.2 | 14.1 ± 7.3 | 18 months |
| Marques Vidas et al., 2024;72 retrospective observational; Spain | T2D, age >18 years, CKD with eGFR >15 mL/min/1.73 m2 | Change in HbA1c and weight | 19 | 26.3 | 68.6 ± 7.4 | 96.7 ± 14.5 | 33.4 ± 3.5 | 7.2 ± 1.1 | 12.1 ± 6.1 | 6 months |
| Volpe et al., 2023;73 prospective observational; Italy | Adults with T2D | Change in body composition | 32 | 56.7 | 66.3 ± 8.5 | 75.3 ± 10.8 | 28.2 ± 3.3 | 6.4 ± 2.7 | 8.7 ± 7.6 | 6 months |
| Weinreich et al., 2025;74 retrospective observational; Denmark | Adults with T2D | Efficacy and safety | 96 | 26 | 63.8 ± 12.7 | 97.4 ± 21.3 | NR | 8.5 ± 3.7 | 16.45 ± 8.22 | 1 year |
| Williams et al., 2024;75 retrospective observational; UK | Adults with T2D | Reasons for oral semaglutide initiation, changes in body weight, BP, glycaemic control, lipid profile, safety data | 76 | 50 | 59.3 (51.4–67.6) | 98.2 (85.1–110.1) | 34.6 (30.7–37.6) | 9.37 ± 1.59 | 13.0 (8.5–19.0) | 12 months |
| Xiong et al., 2024;76 retrospective; China | Adverse drug events of oral semaglutide, from FDA AE reporting system | Adverse drug events of oral semaglutide | 2,398 | 56 | 64.0 (54.5–72.0) | 86.0 (71.0–102.7) | NR | NR | NR | NR |
| Yabe et al., 2025;77 multicentric prospective observational; Japan | Adults with T2D | Change in HbA1c | 624 | 43 | 64.1 ± 14.1 | 72.4 ± 16.1 | 27.5 ± 5 | 7.7 ± 1.1 | 10.7 ± 8.5 | 34–44 weeks |
| Yamada et al., 2023;78 retrospective observational; Japan | Adults with T2D | Change in HbA1c and body weight | 88 | 37.5 | 62 (53.8–68) | 73.6 ± 1.58 | 27.3 ± 0.61 | 8.53 ± 0.17 | 10.5 (5–18) | 6 months |
AE = adverse events; AGP = ambulatory glucose profile; BMI = body mass index; BP = blood pressure; CKD = chronic kidney disease; DPP-4is = dipeptidyl peptidase inhibitors; eGFR = estimated glomerular filtration rate; FDA = Food and Drug Administration; FPG = fasting plasma glucose;HbA1c = glycated haemoglobin; HF = heart failure; HFpEF = heart failure with preserved ejection fraction; ID = study identification; IQR = interquartile range; NR = not reported; SD = standard deviation; T2D = type 2 diabetes.
Table 2: Profile of co-medications taken by patients along with semaglutide in the real-world studies22–27,29–32,34–37,40–43,45–50,52,56–59,62,64,65,67–69,71,74,75,77,78
| Author, year | Number of patients on semaglutide | Biguanides (%) | SGLT2i (%) | Insulins (%) | SUs (%) | TZDs (%) | AGIs (%) |
| Alsheikh et al., 202423 | 245 | 113 (46.12) | 115 (46.94) | 129 (52.65) | 121 (49.39) | NR | NR |
| Delgado Álvarez et al., 202524 | 458 | 224 (48.90) | 114 (24.89) | NR | 32 (6.98) | 4 (0.87) | NR |
| Aoyama et al., 202425 | 153 | 114 (74.51) | 109 (71.24) | 14 (9.15) | 24 (15.69) | 13 (8.59) | 11 (7.19) |
| Aroda et al., 202126 | 782 | 456 (58.31) | 199 (25.44) | NR | 232 (29.67) | 61 (7.80) | NR |
| Baldassarre et al., 202427 | 192 | 167 (86.98) | 72 (37.5) | 20 (10.42) | 9 (4.69) | 19 (9.89) | NR |
| Bawa et al., 202529 | 51 | 39 (76.48) | 12 (23.53) | 30 (58.82) | 23 (45.09) | NR | NR |
| Bonora et al., 202430 | 166 | 154 (92.77) | 35 (21.08) | 10 (6.02) | 12 (7.22) | 7 (4.21) | NR |
| Candido et al., 202331 | 129 | 84 (65.11) | 68 (52.71) | 36 (27.91) | 17 (13.18) | 11 (8.53) | NR |
| Catrina et al., 202432 | 187 | 147 (78.60) | 40 (21.39) | NR | 12 (6.41) | 9 (4.81) | NR |
| Costa et al., 202534 | 104 | NR | NR | NR | 104 (100) | NR | NR |
| Del Prete et al., 202535 | 46 | 39 (84.78) | NR | NR | NR | NR | NR |
| Dutta et al., 202436 | 351 | 285 (81.19) | 203 (57.83) | 95 (27.06) | 169 (48.15) | 12 (3.42) | NR |
| Fadini et al., 202537 | 105 | 98 (93.33) | NR | 7 (6.67) | 11 (10.48) | 4 (3.81) | NR |
| Furusawa et al., 202440 | 434 | 297 (68.43) | 300 (69.12) | 19 (4.37) | 74 (17.05) | 21 (4.84) | 32 (7.34) |
| Gašparini et al., 202441 | 53 | 44 (83.01) | 16 (30.19) | 7 (13.21) | 16 (30.19) | 2 (3.77) | NR |
| Gudibanda et al., 202442 | 188 | 162 (86.17) | 100 (53.19) | 66 (35.12) | 87 (46.28) | NR | 19 (10.11) |
| Hassanein et al., 202543 | 257 | 209 (81.32) | 212 (82.49) | NR | 77 (29.96) | NR | NR |
| Horii et al., 202445 | 6,140 | 3,642 (59.32) | 3,513 (57.221) | 2,652 (43.19) | 1,032 (16.90) | 449 (7.31) | 832 (13.55) |
| van Houtum et al., 202446 | 187 | 152 (81.28) | 8 (4.27) | NR | 117 (62.57) | NR | NR |
| Ishiguro and Nishimura, 202547 | 169 | NR | NR | 5 | NR | NR | NR |
| Jain et al., 202348 | 182 | 103 (56.59) | 70 (38.46) | NR | 49 (26.92) | 1 (0.55) | NR |
| Janić et al., 202349 | 20 | 20 (100) | 10 (50) | NR | 20 (100) | NR | NR |
| Rodríguez Jiménez et al., 202450 | 33 | 25 (75.76) | 15 (45.45) | 24 (72.73) | 6 (18.18) | NR | NR |
| Kick et al., 202452 | 185 | 89 (48.11) | 24 (12.97) | NR | 13 (7.02) | 1 (0.54) | NR |
| Lv et al., 202456 | 5,485 | 4,020 (73.29) | 1,777 (32.39) | NR | NR | NR | NR |
| Manti et al., 202557 | 445 | 269 (60.44) | 30 (6.74) | NR | 10 (2.24) | NR | NR |
| Moreno-Pérez et al., 202458 | 1,018 | 806 (79.17) | 537 (52.75) | 281 (27.60) | 93 (9.13) | NR | NR |
| Oe et al., 202459 | 30 | 13 (43.33) | 14 (46.67) | 3 (10) | 8 (26.67) | 1 (3.33) | 3 (10) |
| Pinto et al., 202462 | 23 | 16 (69.57) | 9 (39.13) | 7 (30.43) | 6 (26.09) | 2 (8.7) | NR |
| Ray et al., 202464 | 80 | 74 (92.5) | 66 (82.5) | 23 (28.75) | 14 (17.5) | NR | NR |
| Roy Chowdhury et al., 202465 | 53 | 43 (81.13) | 34 (64.15) | 10 (18.88) | 33 (62.26) | NR | NR |
| Sansone et al., 202522 | 950 | 316 (33.26) | NR | 278 (29.26) | 634 (66.74) | NR | NR
|
| Sanyal et al., 202567 | 388 | 140 (36.08) | 108 (27.83) | NR | 91 (23.45 | 21 (5.41) | 45 (11.5) |
| Saravanan et al., 202468 | 333 | 266 (79.88) | 147 (44.14) | NR | 73 (21.92) | 11 (3.30) | NR |
| Sato et al., 202469 | 66 | 42 (63.64) | 41 (62.12) | 16 (24.24) | 11 (16.67) | 8 (12.12) | 5 (7.58) |
| Trenas et al., 202571 | 202 | 117 (57.92) | 112 (55.44) | 84 (41.58) | 2 (0.99) | NR | NR |
| Weinreich et al., 202574 | 96 | 73 (76.04) | 72 (75) | 19 (19.79) | NR | NR | NR |
| Williams et al., 202475 | 76 | 19 (25) | 19 (25) | 5 (6.58) | 13 (17.10) | 2 (2.63) | NR |
| Yabe et al., 202577 | 624 | 324 (51.92) | 243 (38.94) | NR | 137 (21.96) | 49 (7.85) | 44 (7.05) |
| Yamada et al., 202378 | 88 | 39 (44.31) | 60 (68.18) | 23 (26.13) | 10 (11.36) | 5 (5.68) | 13 (14.72) |
AGIs = alpha glucosidase inhibitors; NR = not reported; SGLT2i = sodium glucose transporter 2 inhibitor; SUs = sulphonylureas; TZDs = thiazolidinediones.
Risk of bias and quality assessment of the included studies
The risk of bias was calculated to be low among the studies analysed in this SRM. Details have been elaborated on in Supplementary Figure S1.
Study characteristics and baseline profile
Outcomes have been presented for 59 studies involving 28,479 individuals with T2D on oral semaglutide therapy.22–80 The pooled mean age was 61.0 years (95% CI: 59.24–62.75; I²=99.6%; SF-S2). The pooled mean baseline weight was 89.96 kg (95% CI: 86.65–93.27; I²=99.6%; k=47 studies; SF-S3), and baseline BMI was 31.77 kg/m² (95% CI :30.86–32.68; I²=99.5%; SF-S4). Baseline HbA1c was 8.08% (95% CI: 7.90–8.27; I²=98.9%; SF-S5). The mean duration of T2D was 9.92 years (95% CI: 8.93–10.91; I²=98.7%; SF-S6).
Glycaemic outcomes
After 6 months’ use of oral semaglutide, pooled HbA1c reduction was -1.11% (95% CI: -1.37 to -0.86; I²=98.8%; k=34; Figure 2A).22–80 At 12 months, the pooled HbA1c reduction was -1.19% (95% CI: -1.46 to -0.92; I²=99.2%; k=24). The pooled chances of achieving HbA1c <7% were 54.7% (95% CI: 47.6–61.6%; I²=94.4%; k=29; Figure 2B) following oral semaglutide use.
Figure 2: Glycemic and weight outcomes with oral semaglutide22–80
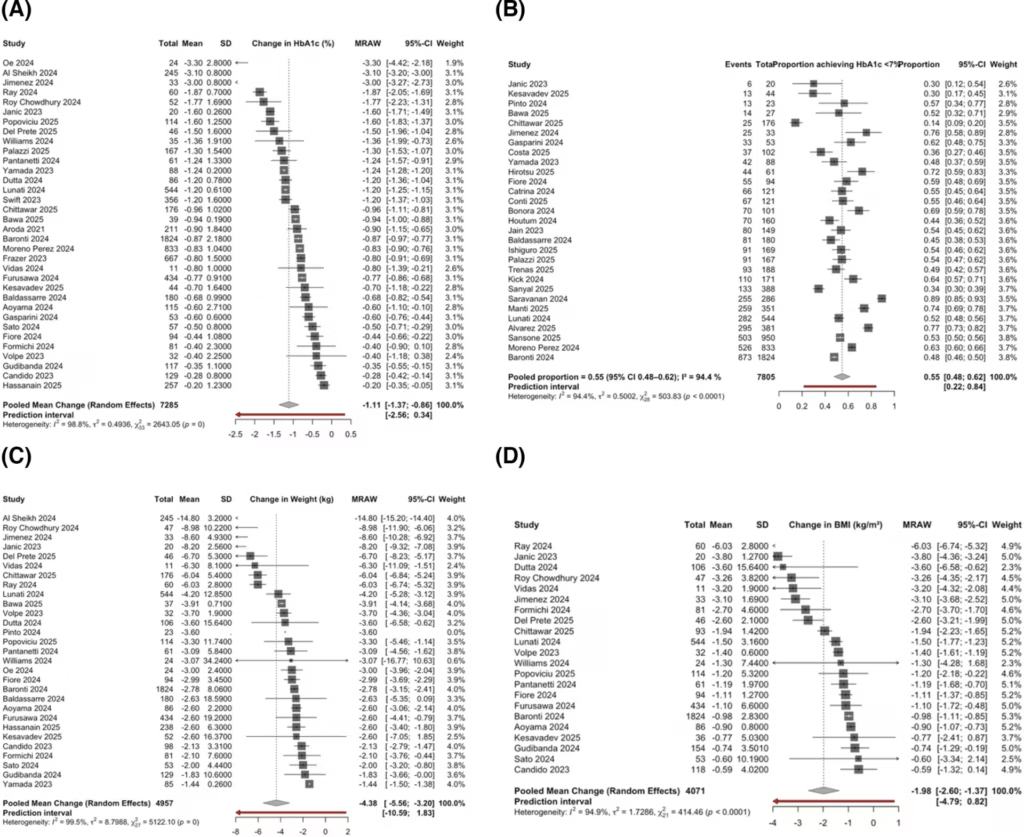
Forest plot for outcomes of change in (A) glycated haemoglobin (%) at 6 months of therapy with oral semaglutide; (B) proportion of participants achieving glycated haemoglobin <7%; (C) change in body weight (kg) at 6 months of therapy with oral semaglutide and (D) change in body mass index (kg/m²) at 6 months of therapy with oral semaglutide
BMI = body mass index; CI = confidence interval; HbA1c = glycated haemoglobin; MRAW = mean using raw scale (raw mean difference); SD = standard deviation.
Weight and body mass index outcomes
After 6 months’ use of oral semaglutide, pooled body weight decreased by -4.38 kg (95% CI: -5.56 to -3.20; I²=99.5%; k=28; Figure 2C), and BMI declined by -1.98 kg/m² (95% CI: -2.60 to -1.37; I²=94.9%; k=22; Figure 2D). After 12 months’ use of oral semaglutide, pooled body weight reduction was -5.96 kg (95% CI: -7.71 to -4.21; I²=99.5%; k=24; Figure 3A).22–74 The occurrence of ≥3% weight loss was 40.8% (95% CI: 31.2–51.2%; I²=96.6%; k=12; Figure 3B), and that of ≥5% weight loss was 30.6% (95% CI: 23.5–38.8%; I²=95.5%; k=22) following oral semaglutide use.
Figure 3: Impact of oral semaglutide on weight loss and blood pressure outcomes22–74
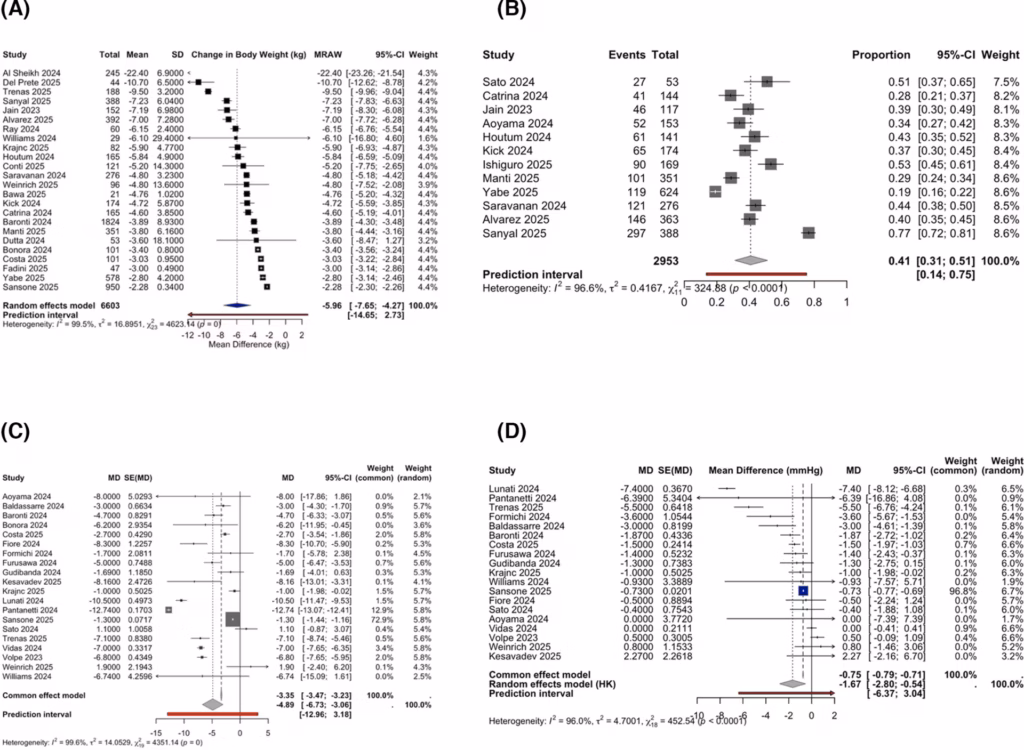
Forest plots for changes in (A) body weight (kg) at 12 months of therapy with oral semaglutide; (B) occurrence of ≥3% weight loss with oral semaglutide; (C) change in systolic blood pressure (mmHg) and (D) change in diastolic blood pressure (mmHg)
CI = confidence interval; HK = Hartung-Knapp method for adjustment of confidence intervals in random-effects meta-analysis; MD = mean difference; MRAW = mean using raw scale (raw mean difference); SD = standard deviation; SE = standard error.
Cardiometabolic parameters
SBP decreased by -4.89 mmHg (95% CI: -6.73 to -3.06; I²=99.6%; k=20; Figure 3C), and DBP decreased by -1.67 mmHg (95% CI: -2.80 to -0.54; I²=96.0%; k=19; Figure 3D) following oral semaglutide use. Total cholesterol decreased by an average of -15.04 mg/dL (95% CI: -19.96 to -10.12; I²=99.3%; k=17; SF-S7) following oral semaglutide use.
Safety and tolerability
Across real-world cohorts, TAEs occurred in 28.9% of patients (95% CI: 20.9–38.4%; I²=96.3%; k=18; Figure 4A).22–79 Gastro-intestinal (GI) adverse events were observed in 20.5% of patients (95% CI: 15.0–27.4%; I²=95.9%; k=25; Figure 4B), including nausea (12.5%; 95% CI: 8.5–18.1%; I²=94.4%; k=22; Figure 4C) and diarrhoea (5.9%; 95% CI: 3.8–9.1%; I²=84.3%; k=15; Figure 4D). Hypoglycaemia occurred in 2.2% of patients (95% CI: 1.1–4.3%; I²=69.3%; k=14; SF-S8), with severe hypoglycaemia in 0.9% of patients (95% CI: 0.4–1.9%; I²=66.1%; k=12; SF-S9). Discontinuation due to adverse drug reactions (ADRs) was observed in 8.7% of patients (95% CI: 6.0–12.3%; I²=75.6%; k=31; SF-S10), and dose reduction due to ADRs was observed in 4.2% of patients (95% CI: 2.0–8.5%; I²=84.3%; k=8; SF-S11).
Figure 4: Adverse events outcomes with oral semaglutide22–79
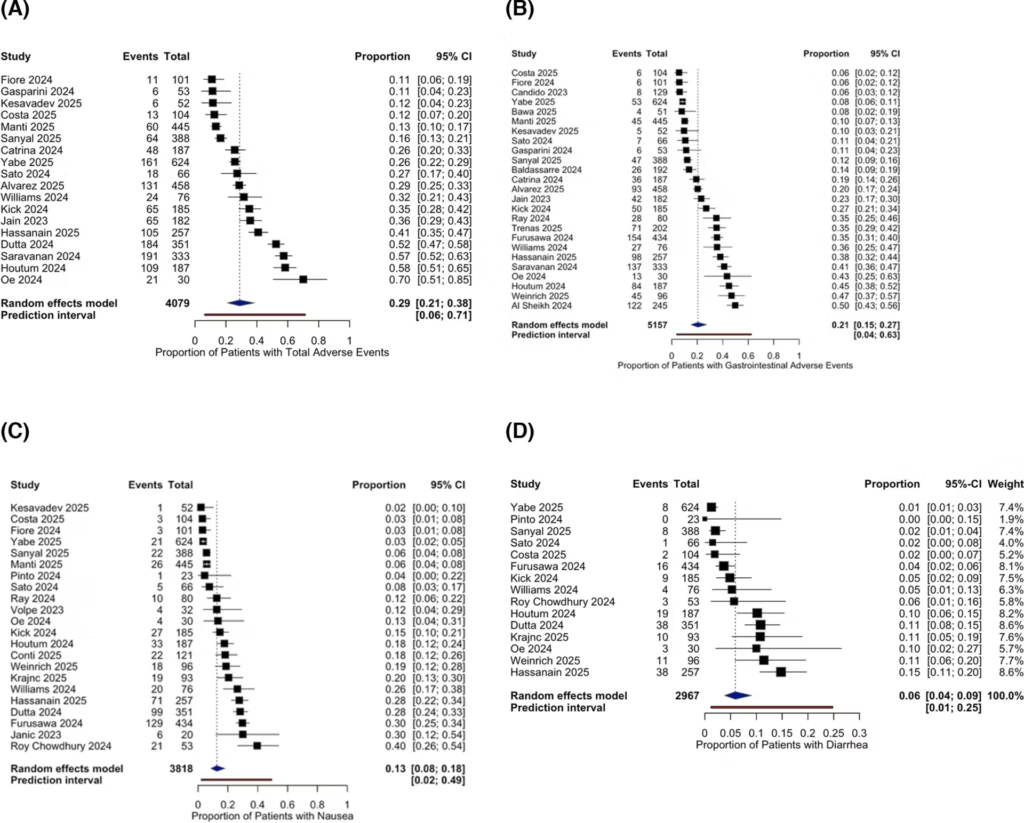
Occurrence of different adverse events among oral semaglutide users, specifically (A) total adverse events, (B) gastrointestinal adverse events, (C) nausea and (D) diarrhoea
CI = confidence interval.
Subgroup analysis of Asian cohorts compared with the rest of the world
Data from 13 studies (1,714 patients) from Asia were compared with data from 21 studies (5,571 patients) from RoW with regard to HbA1c reduction at 6 months of oral semaglutide therapy.14,16–20,23,25,28,30–35,41–43,47,50–53,55–57,61,62,64,67,70 Asians had a higher HbA1c reduction of -1.25% (95% CI: -1.82 to -0.68; I2=99.4%) compared with -1.04% (95% CI: -1.32 to -0.76; I2=96.9%) in patients from RoW (SF-S12). However, the observation was not statistically significant (p=0.39).14–21,23–70
Data from 14 studies (1,772 patients) from Asia were compared with data from 15 studies (3,185 patients) from RoW with regard to body weight reduction at 6 months of oral semaglutide therapy.14,16,18–20,23,25,27,28,30,32,34,35,41–43,47,51,53,54,56,57,61,64,65,67,70 Asians had a marginally higher body weight reduction of -4.45 kg (95% CI: -6.58 to -2.33; I2=99.7%) compared with -4.27 kg (95% CI: -5.59 to -2.96; I2=91.8%) in patients from the RoW (Figure S13).14,16,18–20,23,25,27,28,30,32,34,35,41–43,47,51,53,54,56,57,61,64,65,67,70 However, the observation was not statistically significant (p=0.856).
Data from eight studies (983 patients) from Asia were compared with data from 14 studies (3,088 patients) from RoW with regard to BMI reduction at 6 months of oral semaglutide therapy.16,19,23,25,27,28,30,32,34,41–43,47,53,55–57,61,64,65,67 Asians had a higher BMI reduction of -2.28 kg/m2 (95% CI: -3.91 to -0.65; I2=95.7%) compared with -1.82 kg (95% CI: -2.41 to -1.22; I2=93.5%) in patients from RoW (Figure S14). However, the observation was not statistically significant (p=0.571).16,19,23,25,27,28,30,32,34,41–43,47,53,55–57,61,64,65,67
Data from seven studies (1,624 patients) from Asia were compared with data from 17 studies (5,753 patients) from RoW with regard to HbA1c reduction at 12 months of oral semaglutide therapy.14,15,19–21,24,26–29,38,40,44,49,56,59,60,63,66,67,69 Asians had a higher HbA1c reduction of -1.58% (95% CI: -2.34 to -0.82; I2=99.7%) compared with -0.99% (95% CI: -1.21 to -0.78; I2=94.2%) in patients from the RoW (Figure S15). However, the observation was not statistically significant (p=0.154).14,15,19–21,24,26–29,38,40,44,49,50,56,59,60,63,66,67,69
Data from seven studies (1,621 patients) from Asia were compared with data from 17 studies (4,982 patients) from RoW with regard to body weight reduction at 12 months of oral semaglutide therapy.14,15,19–21,24,26–29,38,40,44,49,50,56,59,60,63,66,67,69 Asians had a higher body weight reduction of -7.45 kg (95% CI: -13.75 to -1.15; I2=99.7%) compared with -5.25 kg (95% CI: -6.45 to -4.06; I2=99.2%) in patients from RoW (Figure S16). However, the observation was not statistically significant (p=0.463).14,15,19–21,24,26–29,38,40,44,45,49,56,59,60,63,66,67,69
Data from eight studies (1,239 patients) from Asia were compared with data from 21 studies (6,566 patients) from RoW with regard to percentage of patients able to achieve the glycaemic target of HbA1c <7% on oral semaglutide therapy.20,25,36,39,41–43,52,53,55,56,59,60,62,64–67,70 The percentage of Asians able to achieve HbA1c <7% was 49.6% (95% CI: 30.1–69.3; I2=97.1%) compared with 56.6% (95% CI: 51.5–61.7; I2=91.6%) in patients from RoW (Figure S17).20,25,36,39,41–43,52,53,55,56,59,60,62,64–67,70
The comparison of changes in SBP, DBP and total cholesterol in Asians compared with RoW has been elaborated in SF-S18, SF-S19 and SF-S20, respectively. The occurrence of different adverse events was largely similar in Asians compared with RoW.14–21,23–70 The occurrence of total AEs, gastrointestinal AEs, nausea, diarrhoea, hypoglycaemia, severe hypoglycaemia, need for oral semaglutide dose reduction and the need for total stoppage of oral semaglutide has been elaborated in SF-S21, SF-S22, SF-S23, SF-S24, SF-S25, SF-S26, SF-S27 and SF-S28, respectively.
Discussion
The global burden of T2D and obesity continues to escalate and contributes to the increasing prevalence of metabolic syndrome, cardiovascular disease and overall morbidity and mortality worldwide. The rise of these twin epidemics has led to an increased demand for agents that combine glycaemic lowering with significant weight loss, cardiovascular safety and patient convenience. Oral semaglutide, the first orally active GLP-1RA, is a potent and convenient agent with benefits for glycaemic control, as well as weight loss.
A literature review revealed that several meta-analyses of randomized controlled trials (RCTs) have been published on oral semaglutide.13,81–85 Their outcomes have been elaborated in Table 3.13,81–85 Since its availability for clinical use, many real-world studies (RWSs) have been published on the use of oral semaglutide.22,79,80 Two narrative reviews have been published to date evaluating the RWS on oral semaglutide without any quantitative analysis.5,86 No meta-analysis has been published to date quantitatively analysing the efficacy and safety of oral semaglutide use in the real-world setting. In addition, regional differences in treatment response and tolerability are unexplored; therefore, we also analysed subgroups based on studies from Asia and the rest of the world (RoW) to evaluate potential variations.
Table 3: Summary of outcomes of meta-analysis of data from randomized controlled trials on the use of oral semaglutide13,81–85
| Authors | Objective | Number of RCTs | Number of participants | Key outcomes |
| Rebelo et al., 202581 | CV outcomes | 5 | OS=6,935; P=6,940 | Reduced CV events; RR, 0.86 (95% CI: 0.78–0.95; p=0.0029; I2=0%) |
| Wang et al., 202582 | Asians versus non-Asians outcomes in T2D | 10 | 7,817 | Superior efficacy in HbA1c reduction; rapid action in Asians |
| Zhang et al., 202483 | Efficacy in T2D | 10 | 9,541 | Good efficacy and safety w.r.t placebo as well as active controls |
| Li et al., 202384 | Efficacy in T2D | 11 | 9,821 | HbA1c reduction with Sema7 and Sema14 was 1.06% (95% CI: 0.81–1.30) and 1.10% (95% CI: 0.88–1.31) w.r.t placebo |
| Alhindi and Avery, 202213 | Oral versus sc semaglutide, other GLP-1RAs; NMA | 12 | 6,840 | OS was non-inferior to sc sema and superior to placebo and other GLP-1RAs in reducing HbA1c and body weight |
| Avgerinos et al., 202085 | Oral sema versus placebo, liraglutide, empagliflozin and sitagliptin in T2D | 11 | 9,890 | Compared with placebo, OS reduced all-cause mortality (OR: 0.58; 95% CI: 0.37–0.92) and CV mortality (OR: 0.55; 95% CI: 0.31–0.98) |
CI = confidence interval; CV = cardiovascular; GLP-1RAs = glucagon-like peptide 1 receptor agonists; HbA1c = glycated haemoglobin;NMA = network meta-analysis;OR = odds ratio; OS = oral semaglutide; P = placebo; RCTs = randomized controlled trials; RR = risk ratio; sc = subcutaneous; sema = semaglutide; T2D = type 2 diabetes; w.r.t = with regard to.
Real-world data reflect a more heterogeneous pool than those usually enrolled in RCTs. Our study represents the largest SRM of real-world data on oral semaglutide, including 59 studies and 28,479 adults with T2D.13–21,23–70,84,85
Our pooled analysis demonstrates that oral semaglutide use in real-world practice is consistently associated with significant improvement in glycaemic control and body weight. Additionally, it exerts favourable effects on blood pressure and lipid parameters. Despite differences in baseline control, comorbidities, adherence and background therapy, nearly half of the patients achieved optimal glycaemic control and weight reduction, which re-enforces the efficacy of semaglutide in real-world scenarios.
In comparison, meta-analysis of RCTs on oral semaglutide, such as the PIONEER-1 (Efficacy and Safety of Oral Semaglutide Versus Placebo in Subjects With Type 2 Diabetes Mellitus Treated With Diet and Exercise Only; ClinicalTrials.gov identifier: NCT02906930), has reported HbA1c reductions of -1.4% and weight reduction of -2.6 kg with a 14 mg once-daily dose of oral semaglutide.14 Comparable outcomes have been reported in PIONEER-2 (empagliflozin comparator on a background of metformin therapy) and PIONEER-3 (sitagliptin comparator).15,16 The near similarity of effect sizes between RCTs and real-world evidence demonstrates the applicability of clinical trials to the real-world environment, even when patient adherence and follow–up are less stringent.14–21,23–73 The persistence of benefits at 12 months in our analysis further supports the long-term durability of oral semaglutide therapy, as observed in extension phases of RCTs (Figure 3A, Supplementary Material 2 [S13]). However, unlike PIONEER-5, which specifically included participants with moderate chronic kidney disease (CKD), our data set mainly comprised individuals without CKD, limiting applicability to this subgroup.87
The safety profile of oral semaglutide remained reassuring. Gastrointestinal adverse events were the most reported, but they were generally mild and transient. SAEs and severe hypoglycaemia were uncommon, aligning with the observations from landmark clinical trials.14 This real-world evidence has shown the effectiveness of oral semaglutide across wide spectra of patients, which are often underrepresented in RCTs, including elderly individuals, those with long–standing T2D and those on multiple drugs (Figures 2 and 3, Supplementary Material 2 [S12-17]). The magnitude of HbA1c and weight reduction suggests that early initiation of oral semaglutide can be an effective alternative for patients averse to injectable GLP-1RAs. Effects of semaglutide on blood pressure and total cholesterol highlight its holistic cardiometabolic benefits (Figure 3).
Subgroup analysis comparing Asian versus RoW revealed numerically greater glycaemic and weight improvement in Asian cohorts; however, these differences were not statistically significant. A meta-analysis by Kim et al. reported modest but statistically significant additional HbA1c reduction in Asian-predominant GLP-1RA trials.88 This has been explained by ethnic differences in β-cell function, BMI and background therapy.88 Our real-world subgroup data reinforce that semaglutide maintains comparable efficacy across geographical and ethnic boundaries.
The key strength of this study is that, to our knowledge, it is the largest global real-world meta-analysis on oral semaglutide to date, covering >27,000 patients across diverse real-world settings. The inclusion of heterogeneous populations provides a multifaceted view of how oral semaglutide performs in routine clinical settings. Another key strength is the use of robust random-effects modelling, which provides statistically relevant pooled estimates despite heterogeneity.
Limitations include the heterogeneity of the included studies, reflecting variations in dose, duration and follow–up. Most studies were observational, with risk of potential confounding by indication and incomplete reporting of adherence. Additionally, heterogeneity remained high for most outcomes, indicating differences in study design and patient population.
Conclusion
This analysis shows that the real-world data on semaglutide are similar to the evidence demonstrated in major RCTs. Despite its limitations, the results of this meta-analysis reaffirm the utility and consistency of the effect of oral semaglutide across different patient groups. These findings bridge the gap between trial outcomes and real-world efficacy and strengthen the role of oral semaglutide as an early therapeutic option for diabetes management, especially in the obese subset.